A Journey to Cost-Effective Observability
In the landscape of logs and metrics, monitoring and observability play pivotal roles in ensuring system reliability and performance. However, the challenge of managing system reliability and performance efficiently, especially from a cost perspective, often becomes a significant concern. Let’s delve into the strategic shift from Datadog to a more cost-effective monitoring solution aligned with our standards, underscoring the process, benefits, and decision-making behind this transition.
Understanding the Need for Change
Traditionally, our organization relied on Datadog for monitoring, attracted by its comprehensive feature set. However, as our infrastructure grew, so did the costs—escalating to 800 euros per cluster monthly, compounded by a 15-day data retention that didn’t comply with our standards and policy. This situation prompted a reevaluation of our monitoring strategy, leading to the exploration of more scalable and cost-effective alternatives. After transitioning, the total cost plummeted to 600 euros monthly for about 20 environments, with the significant advantage of extending data retention up to a year.
The Shift to Internal Central Platform Monitoring
In a decentralized architecture, the independence of each cluster with its own monitoring cluster presents significant challenges, especially during system shutdowns, upgrades, and scaling, due to intricate maintenance costs, coordination complexities, and security risks. As a blockchain company, you won’t hear it from us that often. But as for logs and metrics, we recognize the unique advantages of centralization. It provides a cohesive monitoring solution with a unified dashboard for efficient visualization. This centralized approach is not only cost-effective but also simplifies deployment. A centralized monitoring solution offers a unified dashboard for efficient visualization, simplifying deployment and management while being cost-effective. It eases configuration through agents, streamlines troubleshooting, enhances compliance management, and optimizes resource allocation by providing comprehensive insights. This approach not only improves monitoring efficiency but also ensures uniform adherence to standards across decentralized entities.
Choosing Quickwit and VictoriaMetrics
Our transition to a more efficient monitoring solution was underpinned by a strategic selection of technologies, tailored to meet our specific needs for scalability, cost-effectiveness, and compliance. The selection of Quickwit for log and trace management and VictoriaMetrics for metrics management was driven by their scalability, performance, and cost-effectiveness. These technologies offered a substantial improvement over traditional options like Elasticsearch and Prometheus, especially in terms of handling large volumes of data with better cost efficiency.
How we landed on Quickwit
To enhance the efficiency of the monitoring platform, it is crucial to aggregate, index, and store metrics and logs differently. Logs contain application messages/events, while metrics represent quantifiable values such as integers or floats. Quickwit distinguishes itself as a modern, cloud-native search engine optimized for log/tracing management and analytics, offering a compelling alternative to traditional options like Elasticsearch and Loki. Its design leverages cloud infrastructure, such as object storage, for scalable and cost-effective data handling. Quickwit's architecture, focused on efficiency and simplicity, reduces operational complexity and computational overhead, making it ideal for large-scale log data and analytics. With native support for object storage, optimized performance for logs, and an open-source, extensible framework, Quickwit stands out for applications requiring efficient, scalable, and cost-effective log management solutions in cloud-native environments. Quickwit achieves high performance in a shared-disk architecture through design choices like immutable indexes, which reduce locking and improve caching, and efficient query execution that minimizes data transfer. It leverages a split cache to decrease read requests to shared storage, enhancing speed and reducing costs. The use of cost-effective object storage supports scalability and durability, while the architecture itself allows for seamless horizontal scaling. Data organization is optimized for search and analytics, ensuring fast query execution across large datasets. Lastly, it uses an inverted index to achieve full text search, which was pivotal to choosing Quickwit over Loki. These strategies collectively ensure Quickwit's performance and efficiency in handling large-scale, distributed search and analytics workloads in cloud-native environments.
Why VictoriaMetrics?
VictoriaMetrics, is an advanced time-series database inspired by ClickHouse, incorporating the reuse of the MergeTree table, that we’ve chosen for metrics management due to its remarkable efficiency and scalability. It stands out for its low resource consumption and high ingestion rates, which are crucial for monitoring metrics across our 20 environments. Its design principles, focusing on simplicity and efficiency, ensure that our monitoring platform can scale horizontally without incurring prohibitive costs. VictoriaMetrics excels in handling a high number of active time series, particularly those with high cardinality. In this context, a time series is uniquely identified by its name and a set of labels, becoming active when the application receives one of its samples during the last hour. Additionally, VictoriaMetrics boasts a microservices architecture, enabling high availability for robust and reliable performance.
Benchmark between Victoriametrics and prometheus:
- Ingestion rate: 280K samples/sec
- Active time series: 2.8 million
- Samples scraped and stored: 24.5 billion Running on two instances e2-highmem-4 (4vCPU, 32GB RAM, 1TB HDD persistent disk).
| Disk usage | Memory usage | CPU usage | |
|---|---|---|---|
| Prometheus | 32.3GiB data plus 18GB WAL | 23GiB | 1.5-1.75 of vCPU |
| VictoriaMetrics | 7.2GiB | 4.3GiB | 1.5-1.75 of vCPU |
VictoriaMetrics stands out by utilizing 3.5 times less memory than Prometheus and occupying 4 times less disk space. In terms of medium usage, VictoriaMetrics emerges as the clear winner. Its efficiency is further underscored by its ability to replace Prometheus seamlessly in testing environments, thanks to its single-binary implementation.
To optimize the monitoring platform’s efficiency, it’s essential to differentiate the aggregation, indexing, and storage of metrics and logs. Logs, which consist of application messages or events, contrast with metrics that are quantifiable measurements, typically represented by numerical values. We needed to retain logs for a minimum of one year, ensuring compliance to our standards. Metrics, however, are generally analyzed for their insights into specific timeframes, and it is advisable to retain them for a minimum of three weeks. This duration supports effective tracking of Starton environments’ performance over designated periods.
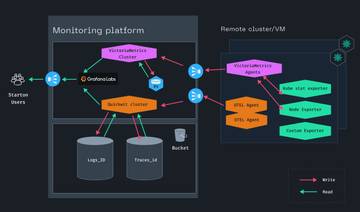
In the scenario of monitoring multiple customer Kubernetes clusters, each environment transmits logs, metrics, and traces via specific agents, including node_exporter for system metrics, vm_agents for additional metrics, and Open telemetry agent for logs and traces. These data points are then collected through the Ingress by the monitoring platform. The logs are indexed and stored in a Google Cloud Storage bucket by the Quickwit cluster, whereas the VictoriaMetrics cluster, functioning as a Prometheus read/write system, employs HDD storage for metrics.
The transition from Datadog to a more cost-effective monitoring solution marks a significant milestone in our quest for operational efficiency and regulatory compliance. By embracing innovative technologies and adopting a strategic approach to monitoring, we have set a new standard for observability in the enterprise domain. In conclusion, combining VictoriaMetrics for time series data monitoring with Quickwit for log management and analytics offers a comprehensive, efficient, and scalable solution for monitoring infrastructure. This combination leverages the strengths of both systems: VictoriaMetrics' efficient handling of time series data for operational monitoring and Quickwit's powerful search capabilities for log data analysis. Together, they provide a robust foundation for monitoring and analyzing the performance and health of modern, distributed systems.This journey underscores the importance of adaptability and forward-thinking in today's dynamic IT landscape, paving the way for future advancements in monitoring and observability.
Are you looking to upgrade your monitoring infrastructure? We’d love to hear from your perspective.