Discovering the Dashboard
The Dashboard serves as the homepage of your project, offering comprehensive data on your service usage. Here, you can easily view the number of IPFS storage units you've used, the number of transactions you've carried out, how many read queries you've made, and the number of Watcher events you've tracked. This information can help you gain a better understanding of which services are most important to your project and how much of each service you use.
BETA FEATURE
The Dashboard is currently a beta feature.
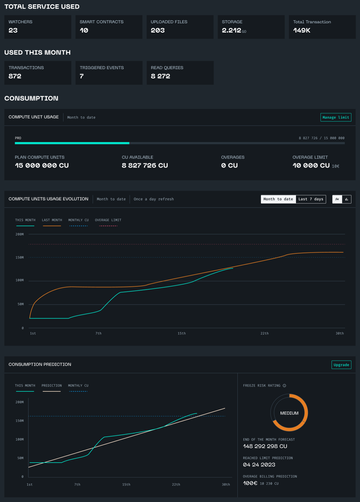
On Dashboard, you will see your usage by service:
Your usage since project creation:
-
Watchers: The number of watchers created.
-
Smart contracts: The number of smart contracts deployed from a template or from the bytecode.
note
Importing Smart contracts already on-chain is not counted in compute units.
-
Uploaded files: The number of files uploaded
-
Storage: The number of Go stored on IPFS
-
Total transactions: The number of transactions executed on this project
Your usage this month:
- Transactions: The number of transactions issued this month.
- Triggered events: The number of events received by watchers this month.
- Read queries: The number of API calls consulting the blockchain.
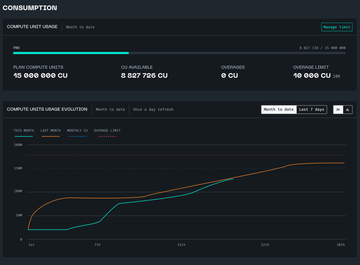
Consumption
On the Dashboard, you can see all of your consumption at a glance. Starton enables you to visualize your consumption data and forecasts.
Compute unit used evolution
This graph is updated daily and allows you to follow your consumption easily. You can compare it with the usage of the previous month. You can confront it to your monthly available Compute units and overage allowance.
Consumption prediction
Starton offers you a preview of the future with Consumption Forecast.
The forecast gives you an estimate of your consumption all month long based on your usage so far.
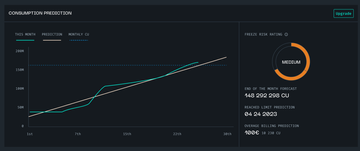
Depending on your remaining compute units, Starton returns a freeze risk rating based on your forecasted usage for the month and the limit set for your plan:
- Low: You’re forecasted usage this month is under what your plan allows and you have set overage permission.
- Medium: Your forecasted usage this month is between the limit of your plan and your overage permission.
- High: Your forecasted usage this month is over your usage limit set.
Whenever no overage limit has been allocated the freeze risk rating is either low or high.